Widac kto nie czytal readme

The bar graphs are as follows:
(L) Instantaneous latency from 0.0 seconds (the bar is empty) to 1.0 seconds (the bar is full height). This is the amount of time that it takes for a message to go from the server, to your client, and back to the server.
(Q) Quality from 100% (the bar is empty) to 50% (the bar is full height). The more data that is lost or garbled during transmission from the server to you, the lower the quality of your connection, and the higher this bar will go.
(S) The time skew (difference) between your client and the server. If your current time is behind where you expect the server to be, this bar will be below center. If it is at the bottom, then you believe that you are 1.0 seconds (or more) behind the server. If your current time is ahead of where you expect the server to be, it will be above center. If it is at the top, then you believe that you are 1.0 seconds (or more) ahead of the server. If the bar reaches the top or bottom, then your client will re-synchronize itself with the server (it will smash its clock).


 ). Pytanko: coz za informacje daje pasek "S" ??


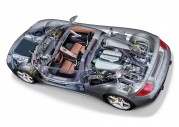 Tapety Porsche
 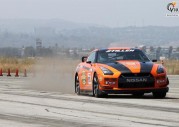 Nissan GT-R po tuningu Stillen - 620-konne auto wyścigowe [24]
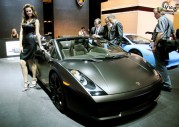 Hostessy na targach w Detroit 2008 [56]
 Nie możecie się doczekać GTA VI? Dzisiaj ściągniesz nowe samochody do ulepszonej GTA V!
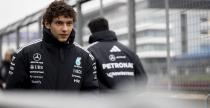 Mercedes W17 zaprezentowany. Pierwsze kilometry na Silverstone
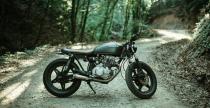 Jak zwiększyć osiągi motocykla Suzuki bez dużych wydatków?
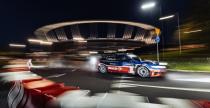 Rajd Polski żegna Mikołajki. Kultowa impreza przenosi się na Śląsk
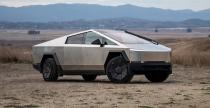 Prztyczek w nosy Trumpa i Muska. Amerykańscy żołnierze nie mogą zabrać Tesli Cybertruck do Niemiec
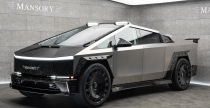 Gdyby Elon Musk i Kanye West mieli dziecko: Tesla Cybertruck po mrocznym tuningu Mansory